ARLAS v26: PROMOTING SMOOTHER DASHBOARD TO DATA DIMENSION INTERACTION
In the last ARLAS release, we introduced user access and permission setting tools to support user management and data security. The newest update, ARLAS version 26, continues to focus on providing users with features that simplify data exploration and maintain scalability.
In this update of ARLAS, new features include: hexagonal H3 grid aggregation
multi-collection search option, metrics table that has multi-collection and multi-metric, ability to zoom to the extent of a geometry and not only to a point, and radius geo selection.
ARLAS current version’s evolution follows after previous updates that promoted a smooth interaction between the dashboard and data dimensions. Below, we highlight how you can use the new features while using ARLAS.
H3 Hexagonal Grid Aggregation On ARLAS-Cloud
For ARLAS-Cloud users, ARLAS now supports layers aggregated over the hexagonal h3 grid.
H3 grids are a hierarchical geospatial indexing system that uses hexagonal cells to partition the Earth's surface. This system supports fast and precise spatial queries and aggregations, and offers a flexible and efficient way to manage and analyze spatial data as shown below.

You can access the demo with this data here.
Search Multi-Collection
We have significantly enhanced the search functionality within ARLAS to allow for cross-collection searches. You can now input a search term and retrieve results from multiple collections simultaneously.
This feature is particularly valuable when dealing with diverse datasets where important information could be found in any number of data collections. By eliminating the need to search each collection individually, this upgrade streamlines the search process and increases efficiency for users working with extensive and varied data as shown below.

You can access the demo with this data here.
Metrics-table : A Multi-Collection And Multi-Metric Powerbar
Sharing information across multiple data sources unlocks the potential for exploration and comparison of distributions over a common field. For example, comparing distributions of country names found in both geographical and other data sources can reveal valuable insights.
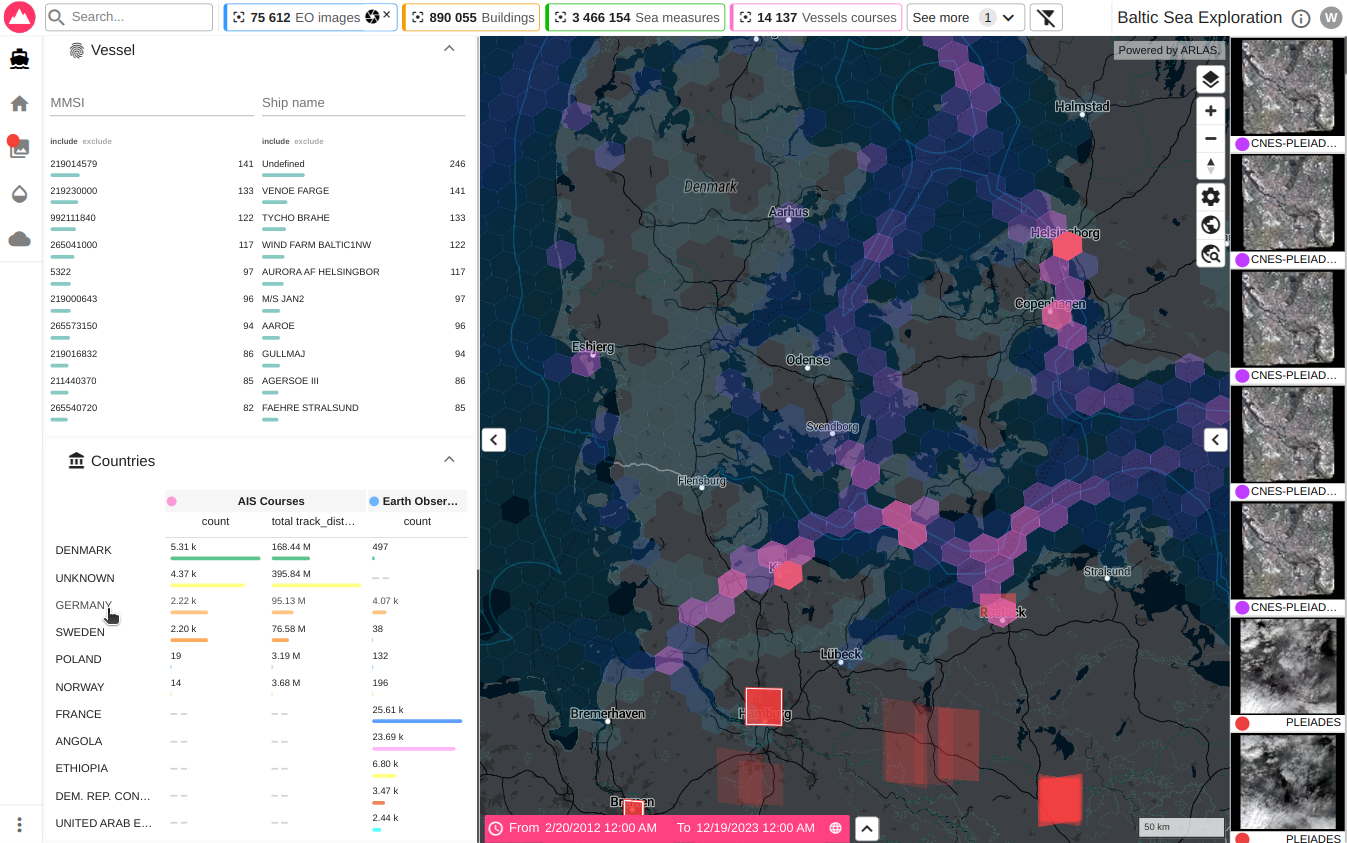
The "Metrics Table" Widget has been enhanced to provide a more powerful and flexible analysis of your data. It now allows you to compute multiple metrics for each unique value within a specified field across multiple collections simultaneously. This means you can compare and contrast how different values within a field perform across various datasets.
Furthermore, any filter applied to a specific value within the field will be applied consistently across all the collections included in the analysis. This ensures that your comparisons are always based on the same subset of data, maintaining the integrity and accuracy of your results.
In the results below, you see the metrics results under each collection for the countries highlighted. Germany has 2200 thousand AIS Courses and just over 4000 Earth observation objects for the selected period.
You can access the demo with this data here.
Zoom To A Geometry (Not Only To A Geo Point)
The "zoom to" button lets users zoom in on an element. However, when the element is large, zooming in on its centroid (a single point) prevents the user from seeing the entire element.
The zoom to button can now accommodate geometries, including lines and polygons, and adjusting the zoom level to fit the real data extent. This helps you keep all the data-of-interest in view, and avoid missing crucial details.
In the display below, selecting zoom in to the departure of one vessel takes us right into the point where we see the ports of departure for the vessel. We zoom in enough to focus on our data-of-interest, but not too much to cut out important information.

You can access the demo with this image here.
Radius Geo Selection
The circle selection tool in ARLAS allows users to define a specific area of interest directly on the map. This feature enhances spatial analysis by enabling users to focus on data within a particular radius around a chosen point. By drawing a circle, users can isolate and examine data relevant to a specific location, making it valuable for investigating the impact of events, assessing proximity-based relationships, or simply exploring data distribution within a defined area.

You can access the demo with this image here.
Coming Soon, ARLAS version 27
ARLAS version 27 will be launched in a couple of weeks. In that update we’ll offer even more ways to explore granular geo data for clear insights.
Whether it's providing extra context about a point of interest or comparing data from different collections, ARLAS's main goal is to eliminate all technical barriers and promote easy access to insights from geospatial big data.
Get Started
ARLAS version 26 is more than just a tool - it's a gateway to exploring, analysing, and visualising geolocated images and data. Designed with GIS experts, data scientists, and decision-makers in mind, it's all about making more informed decisions, faster.
ARLAS version 26 documentation is already available here on our website and has also been captured on Github. You can also access our live demos, where you will see the results of all the possibilities in place. Once you are ready to start, consult our tutorials and let us know how you are using ARLAS. Alternatively, we offer support services to get you started easily and quickly. Contact us here.